
Your feedback can help us improve and enhance our services to the public. Tell us what matters to you in our online Customer Satisfaction Survey.
| Census of Industrial Production - Industrial Local Units 20171 | |||||||
| Border | Dublin | Mid-East | Midland | West | State2 | ||
| Nationality of Ownership | |||||||
| Gross Output (€m) | Irish | 4,226 | 13,697 | 4,435 | 2,008 | 2,638 | 42,989 |
| Foreign | 4,176 | 17,069 | 11,163 | 1,068 | 8,895 | 157,130 | |
| Total | 8,402 | 30,766 | 15,597 | 3,075 | 11,533 | 200,119 | |
| Persons engaged3 | Irish | 15,061 | 32,431 | 22,060 | 10,273 | 13,198 | 144,413 |
| Foreign | 7,395 | 18,635 | 11,832 | 2,619 | 11,630 | 97,948 | |
| Total | 22,456 | 51,066 | 33,892 | 12,892 | 24,828 | 242,361 | |
| Size Class of Unit4 | |||||||
| Gross Output (€m) | Small & medium | 3,685 | 14,367 | 7,357 | 2,046 | 5,083 | 48,523 |
| Large | 4,717 | 16,399 | 8,240 | 1,029 | 6,449 | 151,596 | |
| Persons engaged | Small & medium | 14,881 | 27,768 | 19,709 | 8,551 | 13,829 | 131,691 |
| Large | 7,575 | 23,298 | 14,183 | 4,341 | 10,999 | 110,670 | |
| Wages and salaries (€m) | 862 | 2,719 | 1,525 | 510 | 1,099 | 11,449 | |
| 1 Mid-West, South-East and South-West regions are confidential. | |||||||
| 2 State totals include units not attributable to size class or region. | |||||||
| 3 Number of persons engaged refers to actual number of persons and not full time equivalents. | |||||||
| 4 Small and medium local units employ 249 persons or less while large units employ 250 or more. | |||||||
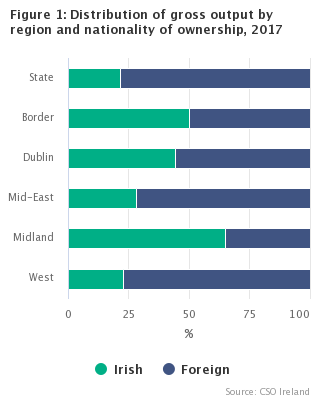
The Dublin region accounted for 15.4% or €30.8 billion of Irish industrial output in 2017. Within this region, Foreign owned enterprises accounted for 55.5% of this output as opposed to Irish owned enterprises with 44.5%. The Mid-East and West regions reported €15.6 billion and €11.5 billion worth of industrial gross output respectively. In contrast to theses, the Midland region produced €3.1 billion or 1.5% of the total industrial output produced in Ireland in 2017.
The Mid-West, South-East and South-West regions combined produced €130.7 billion or 65.3% of Ireland’s total industrial output. See Headline table and Figure 1.